Note
Click here to download the full example code
Plotting azimuth set relationships
The relationships i.e. crosscuts and abutments between lineament & fracture
traces can be determined with fractopo.
from pprint import pprint

import matplotlib as mpl
import matplotlib.pyplot as plt

# Load kb11_network network from examples/example_networks.py
from example_networks import kb11_network

mpl.rcParams["figure.figsize"] = (5, 5)
mpl.rcParams["font.size"] = 8
Analyzing azimuth set relationships
Azimuth sets (set by user):
pprint((kb11_network.azimuth_set_names, kb11_network.azimuth_set_ranges))
(('N-S', 'E-W'), ((135, 45), (45, 135)))
Visualize the relationships with a plot.
figs, _ = kb11_network.plot_azimuth_crosscut_abutting_relationships()

# Edit the figure to better fit the gallery webpage
figs[0].suptitle(
    kb11_network.name,
    fontsize="large",
    fontweight="bold",
    fontfamily="DejaVu Sans",
)
plt.tight_layout()
plt.show()
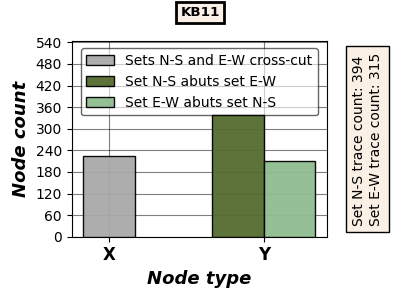
The relationships are also accessible in numerical form as a pandas
DataFrame.
pprint(kb11_network.azimuth_set_relationships)
   name        sets    x    y y-reverse error-count
0  KB11  (N-S, E-W)  224  339       210           0
Total running time of the script: ( 0 minutes 0.164 seconds)