Note
Click here to download the full example code
Plotting multi-scale fracture networks with fractopo
Initializing
import matplotlib as mpl
import matplotlib.pyplot as plt

# Load kb11_network and hastholmen_network
from example_networks import hastholmen_network, kb11_network

from fractopo import MultiNetwork

mpl.rcParams["figure.figsize"] = (5, 5)
mpl.rcParams["font.size"] = 8
Create MultiNetwork object
multi_network = MultiNetwork((kb11_network, hastholmen_network))
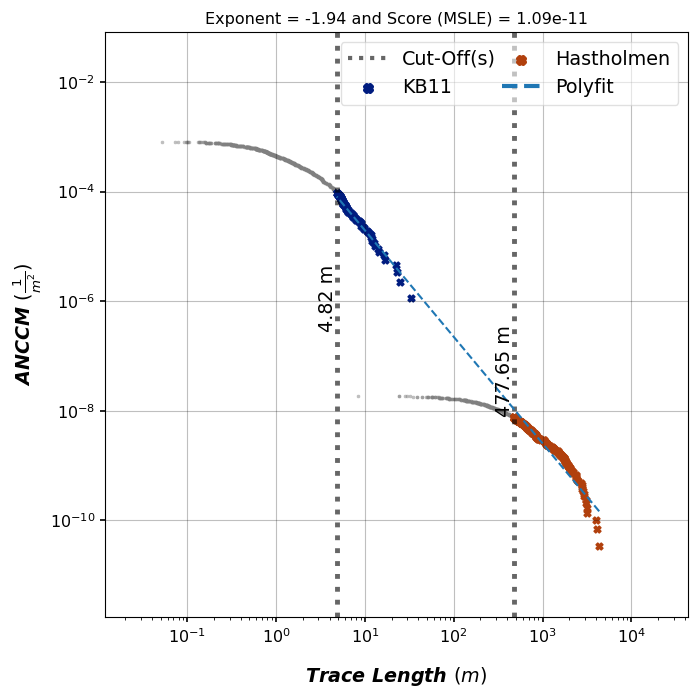
Plot automatically cut length distributions with a multi-scale fit
Powerlaw exponent and fit ‘score’ are embedded into the plots. MSLE = Mean Squared Logarithmic Error
# Log-log plot of MultiNetwork trace length distribution
mld_traces, polyfit, fig, ax = multi_network.plot_multi_length_distribution(
    using_branches=False,
    automatic_cut_offs=True,
    plot_truncated_data=True,
)

# Visual plot setup
plt.tight_layout()
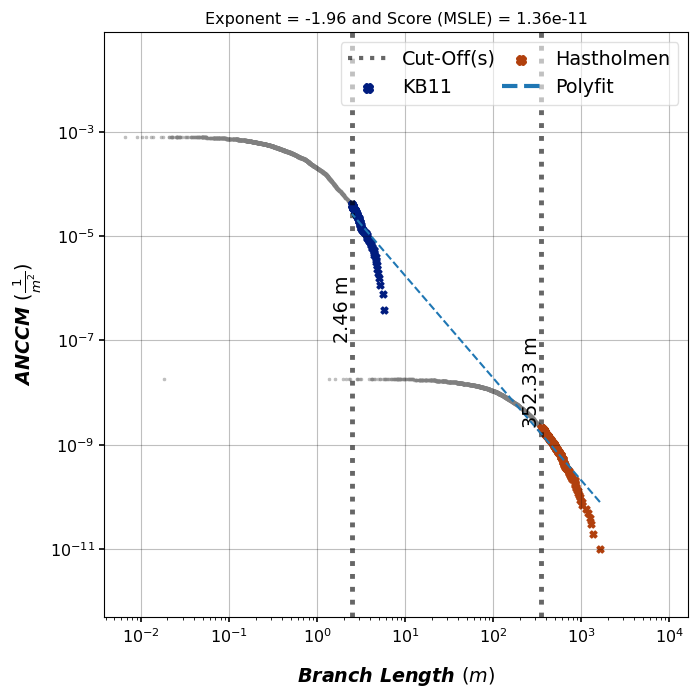
# Log-log plot of MultiNetwork branch length distribution
mld_branches, polyfit, fig, ax = multi_network.plot_multi_length_distribution(
    using_branches=True,
    automatic_cut_offs=True,
    plot_truncated_data=True,
)

# Visual plot setup
plt.tight_layout()
Numerical details of multi-scale length distributions
# The returned MultiLengthDistribution objects contain details
print(f"Exponent of traces fit: {polyfit.m_value}")
Exponent of traces fit: -1.9628074179036543
print(f"Exponent of branches fit: {polyfit.m_value}")
Exponent of branches fit: -1.9628074179036543
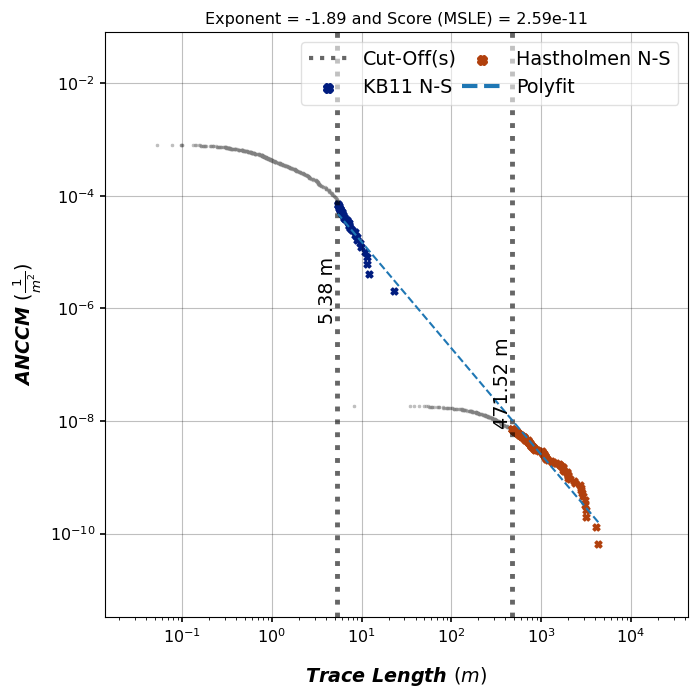
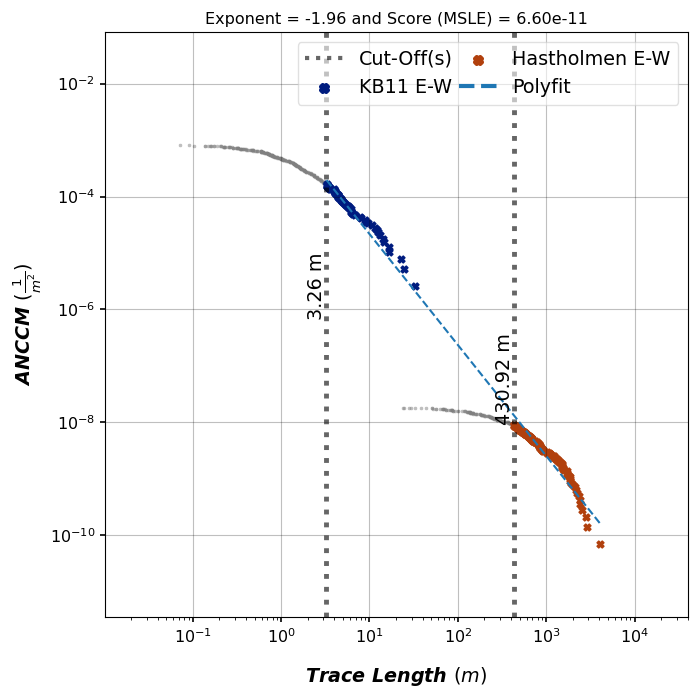
Plot set-wise multi-scale distributions for traces
Requires that same azimuth sets are defined in all Networks in the MultiNetwork.
# Set names and ranges
# MultiNetwork.collective_azimuth_sets() will check that same azimuth sets are
# set in all Networks.
print(multi_network.collective_azimuth_sets())
(('N-S', 'E-W'), ((135, 45), (45, 135)))
mlds, polyfits, figs, axes = multi_network.plot_trace_azimuth_set_lengths(
    automatic_cut_offs=True,
    plot_truncated_data=True,
)

# Just some visual plot setup...
for fig in figs:
    fig.tight_layout()
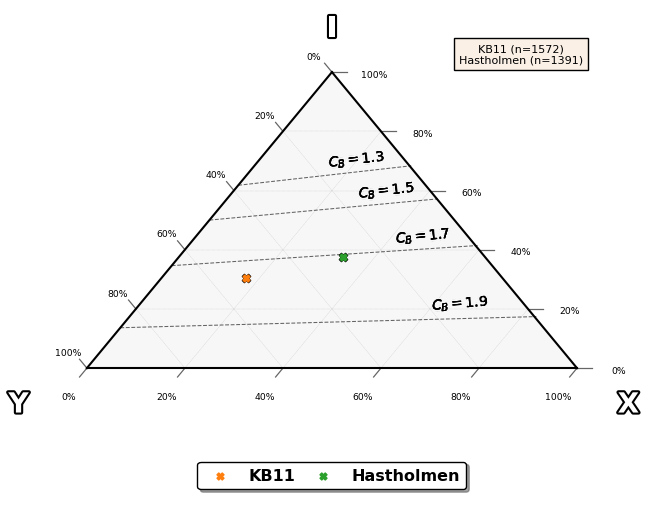
Plot ternary plots of nodes and branches
Topological XYI-node plot
fig, ax, tax = multi_network.plot_xyi()

# Visual plot setup
plt.tight_layout()
/home/docs/checkouts/readthedocs.org/user_builds/fractopo/envs/latest/lib/python3.8/site-packages/ternary/plotting.py:148: UserWarning: No data for colormapping provided via 'c'. Parameters 'vmin', 'vmax' will be ignored
  ax.scatter(xs, ys, vmin=vmin, vmax=vmax, **kwargs)
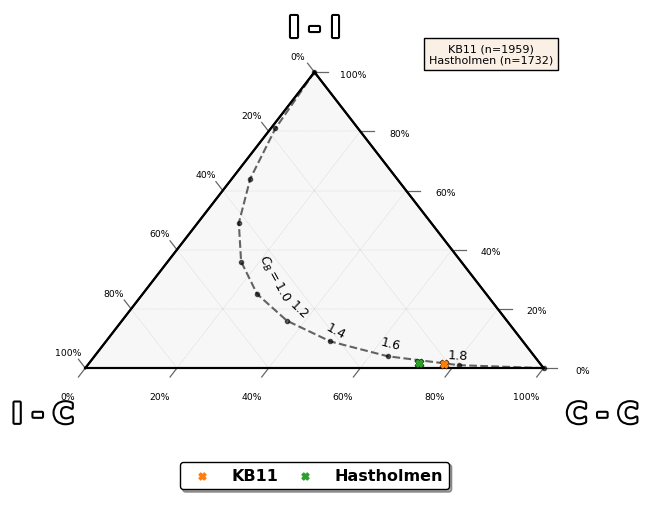
Topological branch type plot
fig, ax, tax = multi_network.plot_branch()

# Visual plot setup
plt.tight_layout()
/home/docs/checkouts/readthedocs.org/user_builds/fractopo/envs/latest/lib/python3.8/site-packages/ternary/plotting.py:148: UserWarning: No data for colormapping provided via 'c'. Parameters 'vmin', 'vmax' will be ignored
  ax.scatter(xs, ys, vmin=vmin, vmax=vmax, **kwargs)
Total running time of the script: ( 0 minutes 5.082 seconds)