Note
Click here to download the full example code
Determining topological branches and nodes
A network consists of the geometrical traces and their interactions with each other.
Imports
import geopandas as gpd
import matplotlib.pyplot as plt

# Import the geometries used to create traces and target areas.
from shapely.geometry import LineString, Polygon

# Function to determine branches and nodes
# Network, when initialized with determine_branches_nodes=True,
# will call this to determine them internally.
from fractopo.branches_and_nodes import branches_and_nodes
Define trace and target area geometries manually
traces = gpd.GeoDataFrame(
    {
        "geometry": [
            LineString([(-2, 0), (4, 0)]),
            LineString([(0, -2), (0, 4)]),
            LineString([(-1, 1), (0, 1)]),
        ]
    }
)

area = gpd.GeoDataFrame({"geometry": [Polygon([(-2, -2), (2, -2), (2, 2), (-2, 2)])]})
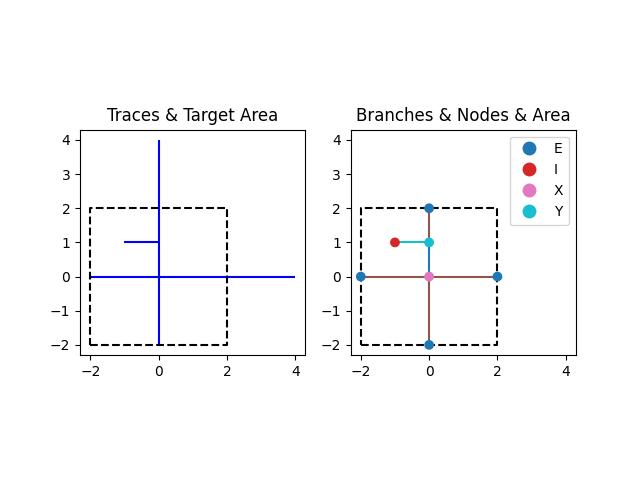
Plot the traces and target area with their branches and nodes
After we’ve manually created some traces and delineated their target area
with the area Polygon we can determine branches and nodes
of the traces network.
You may notice that the branches and nodes are cropped to the original target area. Branches and nodes will never be determined outside the target area.
Determine branches and nodes
branches, nodes = branches_and_nodes(traces, area, snap_threshold=0.001)
/home/docs/checkouts/readthedocs.org/user_builds/fractopo/envs/latest/lib/python3.8/site-packages/pygeos/io.py:89: UserWarning: The shapely GEOS version (3.10.3-CAPI-1.16.1) is incompatible with the PyGEOS GEOS version (3.10.4-CAPI-1.16.2). Conversions between both will be slow
  warnings.warn(
Plot the data
# Initialize matplotlib figure and two axes
# One axis is for traces and other for determined branches and nodes
fig, axes = plt.subplots(1, 2)

# Plot traces
traces.plot(ax=axes[0], color="blue", label="Traces")

# Plot the area boundary, not the full Polygon
area.boundary.plot(ax=axes[0], color="black", label="Target Area", linestyle="dashed")
axes[0].set_title("Traces & Target Area")

# Plot the created branches and nodes
branches_axes = branches.plot(ax=axes[1], column="Connection", categorical=True)
nodes.plot(ax=axes[1], column="Class", zorder=10, legend=True, categorical=True)
axes[1].set_title("Branches & Nodes & Area")

# Plot the area boundary to the other ax as well
area.boundary.plot(ax=axes[1], color="black", linestyle="dashed")

# Set second plot boundaries to same as first
x_min, y_min, x_max, y_max = traces.total_bounds
axes[1].set_xlim(*axes[0].get_xlim())
axes[1].set_ylim(*axes[0].get_ylim())

# Show the plot
plt.show()
Total running time of the script: ( 0 minutes 0.553 seconds)