Note
Click here to download the full example code
Plotting rose plots with fractopo
Initializing
from pprint import pprint

# Load kb11_network network from examples/example_networks.py
from example_networks import kb11_network
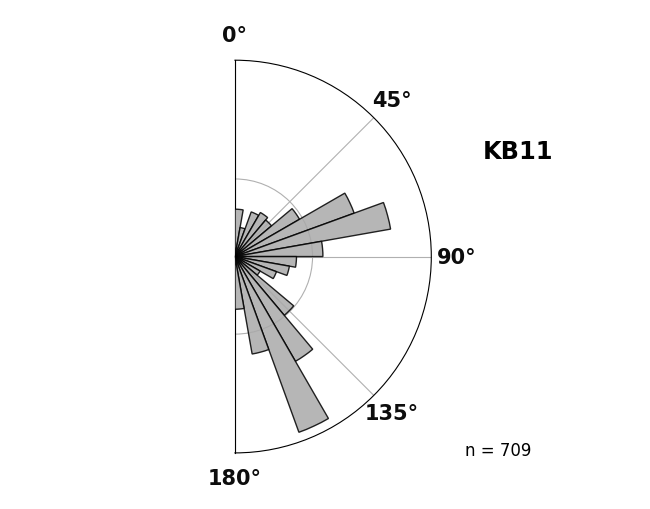
Plotting a rose plot of fracture network trace orientations
# Rose plot of network trace orientations
azimuth_bins, fig, ax = kb11_network.plot_trace_azimuth()
Plotting a rose plot of fracture network branch orientations
# Rose plot of network branch orientations
kb11_network.plot_branch_azimuth()
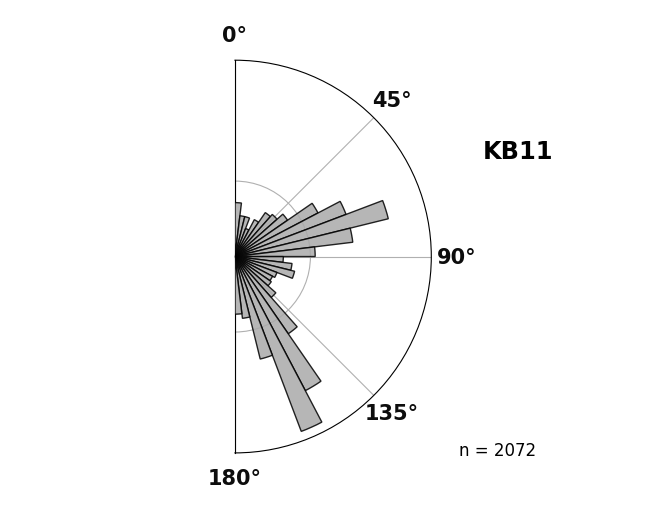
(AzimuthBins(bin_width=6.923076923076923, bin_locs=array([  3.46153846,  10.38461538,  17.30769231,  24.23076923,
        31.15384615,  38.07692308,  45.        ,  51.92307692,
        58.84615385,  65.76923077,  72.69230769,  79.61538462,
        86.53846154,  93.46153846, 100.38461538, 107.30769231,
       114.23076923, 121.15384615, 128.07692308, 135.        ,
       141.92307692, 148.84615385, 155.76923077, 162.69230769,
       169.61538462, 176.53846154]), bin_heights=array([ 23.85186242,  13.85935962,  13.88406748,   7.36702792,
        14.23952299,  23.40760406,  25.99082394,  33.56150329,
        72.13951553, 115.79880919, 204.63184844, 115.57635472,
        52.8100409 ,  19.18577615,  27.12296283,  30.95261975,
        16.55924935,  14.77946813,  15.99990073,  24.51727887,
        72.23261948, 188.16867511, 286.88599501,  91.41047876,
        31.76997234,  27.22640228])), <Figure size 650x510 with 1 Axes>, <PolarAxes: title={'center': 'KB11'}>)
Numerical data is accessible with methods and class properties
pprint((kb11_network.branch_azimuth_set_counts, kb11_network.trace_azimuth_set_counts))
({'E-W': 1045, 'N-S': 1027}, {'E-W': 315, 'N-S': 394})
The azimuth sets were not explicitly given during Network creation so they are set to defaults.
pprint((kb11_network.azimuth_set_names, kb11_network.azimuth_set_ranges))
(('N-S', 'E-W'), ((135, 45), (45, 135)))
Total running time of the script: ( 0 minutes 0.484 seconds)